
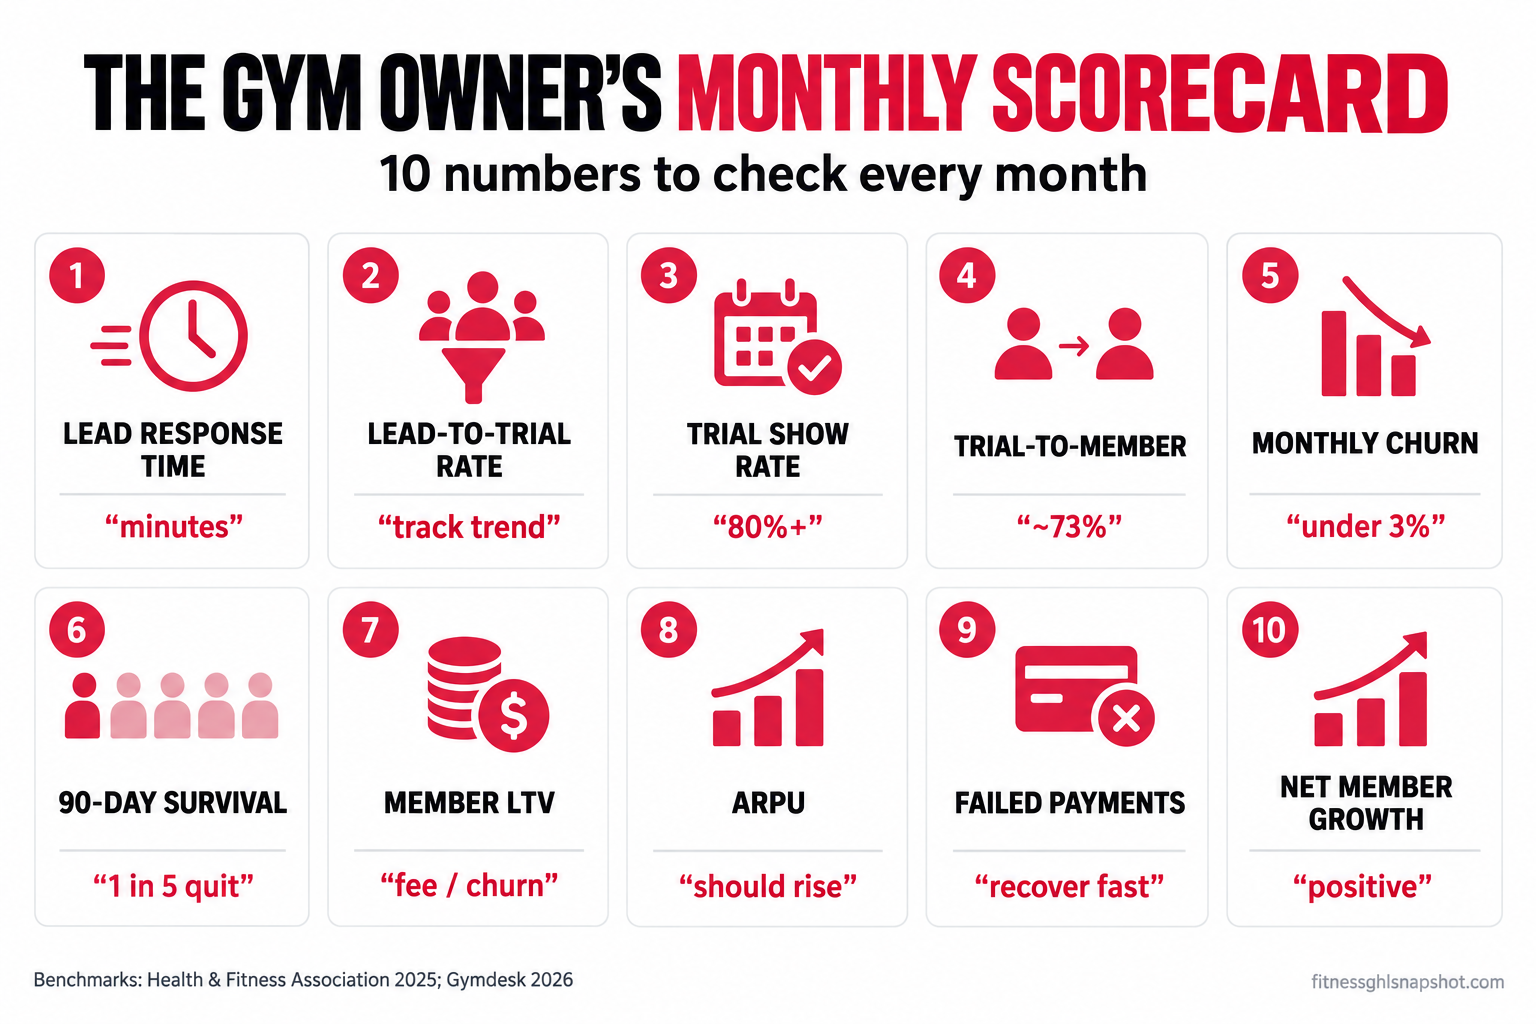
Here is the short version: most gym owners track one number, their member count, and it is the number that hides the most. A full-looking gym can be losing members faster than it signs them, converting one trial in five, and bleeding a point of revenue a month to declined cards, and the member count will look fine the whole time. The fix is a monthly scorecard of 10 numbers that cover the whole business: how fast you answer leads, how many trials book and show, how many convert, how many members you keep, what each one is worth, and whether you are growing or shrinking. None of them need an accountant. All of them fit on one page.
It is the last day of the month and you are about to tell your partner the gym “had a good month.” The classes looked full. The vibe was good. But when they ask “so are we up or down on members?” you pause, because you are not actually sure. You know roughly how many people walked in. You do not know how many quietly left, how many trials you lost, or whether the two are cancelling each other out. That pause is the problem this post fixes. By the end you will have 10 numbers, each with a formula, a benchmark, and the one way it tends to lie to you.
Table of contents
- Why member count is the wrong number to live by
- The benchmarks to measure yourself against
- The scorecard at a glance
- The 10 numbers, one by one
- Run it for your size: solo, studio, multi-coach gym
- Steal this: the one-page monthly scorecard
- Objections operators raise
- The bottom line
- FAQ
Why member count is the wrong number to live by
Member count is a net figure. It takes everyone who joined, subtracts everyone who left, and gives you one survivor number that tells you nothing about either side. A gym that signs 20 and loses 20 looks identical to a gym that signs 2 and loses 2, and the first one is spending a fortune on marketing to stand still while the second is quietly dying. You cannot tell from the headcount. You can only tell by splitting it apart.
That is the whole idea of a scorecard. You stop staring at the one number that averages everything out and start tracking the handful of numbers underneath it: how many leads came in, how fast you called them, how many booked, how many showed, how many converted, how many you kept, and what each one is worth. When one of those moves the wrong way, the scorecard tells you where. Member count just tells you that something, somewhere, is off, usually a month too late to act.
You do not need new software for this. Every number here comes out of your booking tool, your payment processor, and a calendar. The work is deciding to look once a month and write it down next to last month. That habit, not any single metric, separates owners who steer from owners who react.
The benchmarks to measure yourself against
Before the 10 numbers, a word on comparison. Benchmarks are useful as a sanity check, not a scoreboard. Your own last month is the number that matters most. Still, it helps to know where the floor is.
Two honest caveats. The 66.4% retention and 5.5% net growth figures are from the Health & Fitness Association’s 2025 report, built on 175 companies and more than 17,000 facilities across 27 countries, surveyed April to June 2025 (HFA). Those are averages across a mixed global sample, so treat them as a rough bar. The 73% trial conversion and the attendance-churn numbers below come from Gymdesk’s 2026 report, drawn from its own platform and skewed toward martial arts and combat-sports schools (Gymdesk). Different segment, same shape of lesson. Use these to ask “am I roughly in the right zip code,” then compare yourself to yourself.
The scorecard at a glance
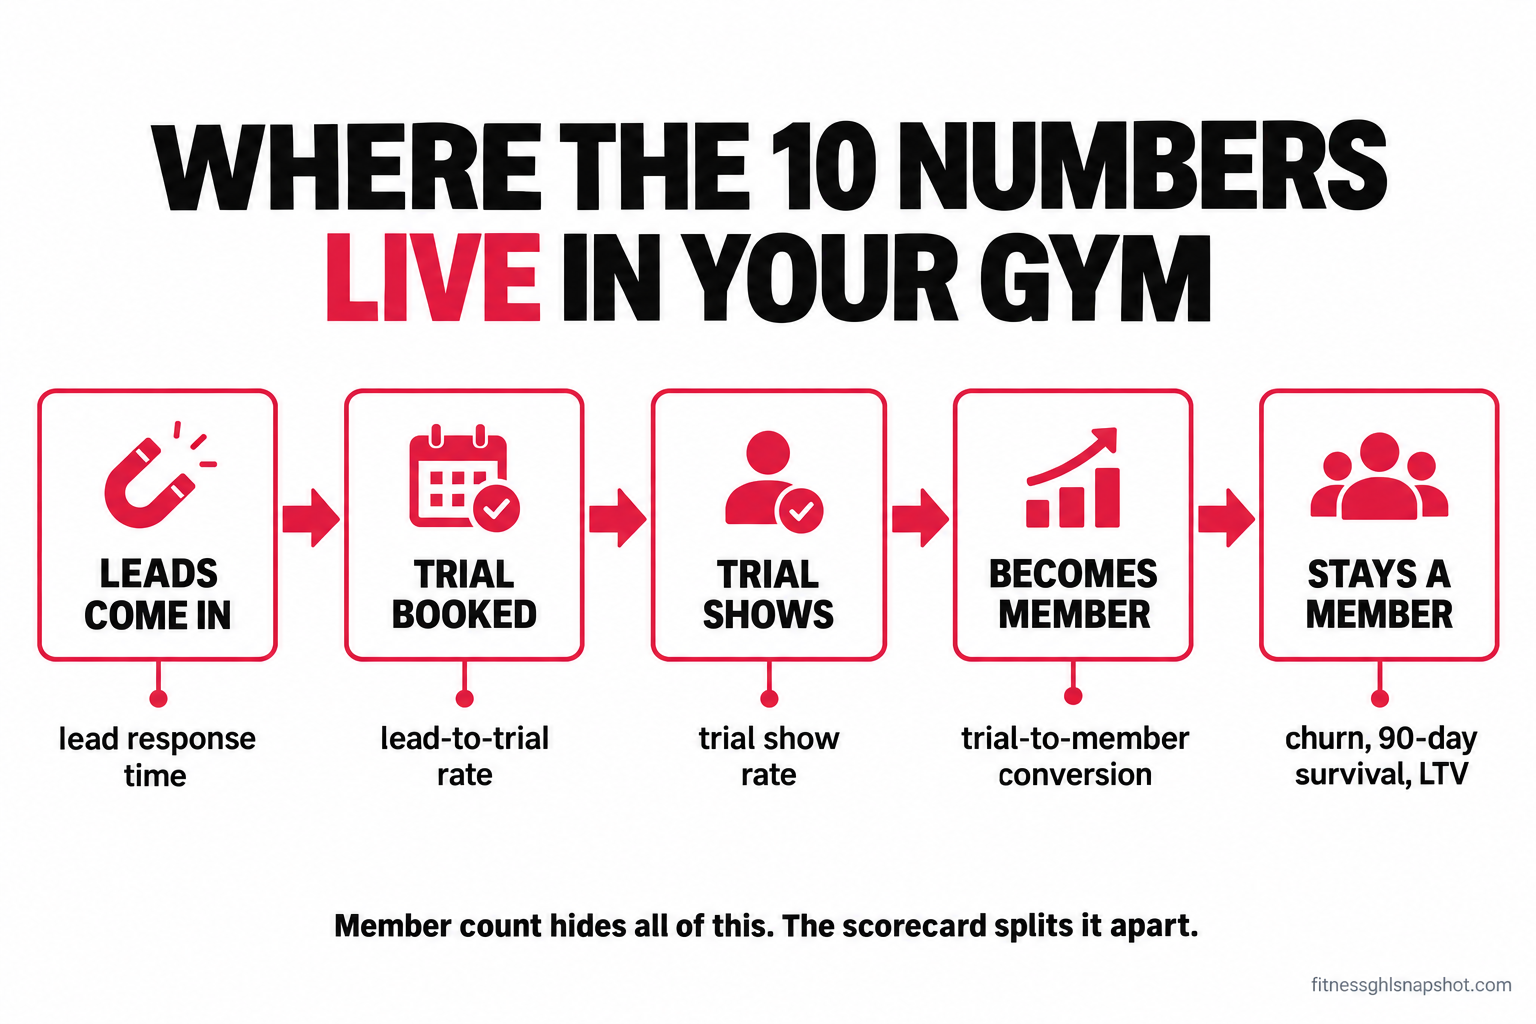
The 10 numbers fall into four groups that mirror how a member actually moves through your gym:
- Getting leads to show up: lead response time, lead-to-trial booking rate, trial show rate.
- Turning trials into members: trial-to-member conversion rate.
- Keeping members: monthly churn, 90-day new-member survival, failed-payment rate.
- What it all adds up to: member lifespan and LTV, ARPU, net member growth.
Track all 10 every month. The groups tell you where to look when the bottom-line number disappoints: if net growth is flat, the problem is either the top of the funnel (leads, trials) or the bottom (churn, failed payments), and the other eight numbers tell you which.
The 10 numbers, one by one
1. Lead response time (speed to lead)
What it is: the gap between a lead coming in (form fill, missed call, DM) and your first real reply. How to calculate: take 20 recent leads, note the time in and the time of first response, and use the median. The benchmark: minutes, not hours. The odds of qualifying a lead fall roughly 21-fold when response time slips from 5 minutes to 30, across a study of over 15,000 leads and 100,000 call attempts (Lead Response Management). Where it lies to you: your average looks fine because business-hours leads got answered fast, while the 7pm and Sunday leads, the ones most likely to be ready to buy, waited 14 hours. Measure your median response outside staffed hours separately. That is usually where the money leaks, and it is exactly what a missed-call text-back or after-hours follow-up system is for.
2. Lead-to-trial booking rate
What it is: of the leads who contact you, the share who actually book a trial, intro, or tour. How to calculate: trials booked this month divided by leads received this month. The benchmark: there is no clean public number, so this one is a compare-to-yourself metric from day one. Most gyms who have never measured it are shocked how low it is, because “a lead” and “a booked appointment” are very different things. Where it lies to you: if you count every Instagram comment and every price-shopper as a lead, your rate looks terrible; if you only count qualified inquiries, it looks great. Pick one definition of “lead” and keep it stable month to month, or the trend is meaningless. The lever here is follow-up persistence: most bookings come from the second, third, and fourth touch, not the first.
3. Trial show rate
What it is: of the people who booked a trial, the share who physically turned up. How to calculate: trials attended divided by trials booked. The benchmark: aim for 80%+; below 60% you have a reminder problem, not a marketing problem. Where it lies to you: a booked calendar feels like success, so owners celebrate bookings and never check attendance. A no-show is worse than a lost lead because you paid to acquire it, blocked a coach’s time, and got nothing. Timing matters: about half of trial conversions happen in the first 10 days and two-thirds within two weeks, and if a trial has not converted by day 14 it is probably gone (Gymdesk). The fix is boring and it works: confirmation plus text reminders, not email, and a same-day rebook offer on a no-show. There is a full no-show playbook if this is your leak.
4. Trial-to-member conversion rate
What it is: the share of people who tried the gym and became paying members. How to calculate: new members this month divided by trials attended this month. The benchmark: Gymdesk reports about 73% of real free trials convert, though that is a martial-arts-heavy sample, and paid intros tend to convert higher than fully free ones (Gymdesk). Where it lies to you: this is the number people most want to believe is high, so they measure it loosely, counting anyone who “seemed keen.” Only count a signed, paying member. Also watch the timing: because most conversions happen inside two weeks, a slow or absent follow-up after the trial is where this number dies. If your conversion is weak, the problem is rarely the workout; it is that nobody asked for the sale on day 1 and nobody followed up on days 3 and 7. The trial-to-member playbook breaks that window down.
5. Monthly churn rate
What it is: the share of members who cancel in a month. How to calculate: members lost this month divided by members at the start of the month. The benchmark: ongoing churn commonly runs 2% to 3.5% a month (Gymdesk); the industry retained 66.4% of members across 2025, so about a third leave annually (HFA). Where it lies to you: you count only members who formally cancelled and miss the ones whose card failed and were never chased, who read as “active” until the system gives up. That silent churn inflates your member count while draining your bank, so track voluntary cancels and failed-payment losses separately. Attendance is the earliest warning: Gymdesk found members attending less than once every two weeks cancelled at 44.2% over 24 months versus 23.2% for those training three or more times a week. The member who stops showing is about to leave. Catching that is the point of a silent-churn system.
Share of memberships cancelled over 24 months by attendance frequency, across 801,000 memberships. Rare attenders quit at nearly double the rate of regulars, which is why attendance drop is your best early churn signal. Source: Gymdesk 2026 Benchmark Report (martial-arts-heavy sample).
6. 90-day new-member survival
What it is: of members who joined 90+ days ago, the share still active at the 90-day mark. How to calculate: take a cohort that joined three months back and check how many are still paying now. The benchmark: Gymdesk found nearly one in five new members quits inside 90 days (Gymdesk). The first three months are the most fragile stretch of the whole relationship. Where it lies to you: blended churn averages your loyal five-year members in with your three-week dropouts, so a serious early-churn problem looks mild. Measuring new members as their own cohort exposes it. If 90-day survival is weak, your onboarding is weak, not your gym. The members who build a habit and a friend in month one stay for years; the ones who come twice and feel invisible are gone by month two. A structured first-30-days onboarding sequence is the best fix.
7. Member lifespan and lifetime value (LTV)
What it is: how long the average member stays, and the total revenue they generate before they go. How to calculate: average member lifespan in months is roughly 1 divided by your monthly churn rate; LTV is your average monthly fee times that lifespan. At 4% monthly churn a member stays about 25 months. The benchmark: there is no universal number because it depends on your price and churn, which is exactly why you calculate your own. Where it lies to you: LTV looks abstract until you put it next to what you spend to get a member, and then it becomes the most important number you have. A 5% lift in retention can raise profit 25% to 95% because LTV climbs non-linearly as churn drops (HBR). The chart below shows why: shaving one point off monthly churn adds months of revenue per member, and it compounds across every member you have. The full LTV breakdown has the margin-adjusted version.
Average member lifespan in months at different monthly churn rates (lifespan ≈ 1 ÷ monthly churn). Dropping churn from 5% to 2% more than doubles how long a member stays, and multiplies their lifetime value. Illustrative, from the churn formula.
8. Average revenue per member (ARPU)
What it is: your total collected monthly membership revenue divided by active members. How to calculate: collected membership revenue this month divided by member count. The benchmark: a compare-to-yourself number, but direction matters: it should rise as you add value, not fall as you discount to fill classes. Where it lies to you: use collected revenue, not billed. Divide billed revenue by headcount and you overstate ARPU by exactly your failed-payment rate, and that gap is real money. ARPU is the quiet lever most owners ignore because raising it feels like raising prices, but it also moves when you add paid small-group, retail, or an annual plan, and when you stop discounting new joiners below your existing members. One dollar on ARPU, across every member and their whole lifespan, is a large number.
9. Failed-payment rate (involuntary churn)
What it is: the share of monthly charges that fail. How to calculate: failed charges divided by total charges attempted in the month. The benchmark: it is never zero; cards expire, get replaced, and hit limits. The goal is to recover most of them fast. Where it lies to you: failed payments are invisible unless you go looking, because the member did not cancel, did not complain, and is still on your roster. They are the purest silent churn: revenue you earned and did not collect, plus a member who drifts away when the awkward “your card didn’t work” conversation never happens. Stripe’s standard rate of 2.9% + 30¢ is your baseline cost per successful charge (Stripe); the charges that fail cost you the whole membership. A simple dunning sequence, a text and email with a one-tap update link, recovers a large share. The dunning playbook covers the sequence.
10. Net member growth
What it is: new members minus lost members, the honest version of “how was the month.” How to calculate: members gained minus members lost (voluntary cancels plus failed-payment losses). The benchmark: the industry averaged 5.5% net membership growth in 2024 (HFA). Positive and steady beats a spike followed by a slide. Where it lies to you: this is the number member count pretends to be, except you compute it from both sides so you can see which side is the problem. A flat net with high gains and high losses means a retention hole you are paying to fill; a flat net with low gains and low losses means a marketing problem. Pair this with churn and you know how many members you must sign each month just to stand still. That replacement number is usually the most sobering line on the scorecard, and the one that makes the case for fixing retention before buying more leads.
Run it for your size: solo, studio, multi-coach gym
The same 10 numbers matter for everyone, but which ones you fix first changes with your size.
Solo trainer or small PT team (20 to 100 clients). You live and die on conversion and retention, because you cannot out-market a leaky bucket when you are the marketer, coach, and front desk. Watch trial-to-member conversion and 90-day survival hardest. Lead volume is low, so every response time matters; one missed inquiry is a real share of your month. ARPU is your secret weapon: with a small roster you can charge premium prices for genuine attention, so rising ARPU, not a rising headcount, is how you grow income without burning out.
Boutique studio (80 to 250 members, 2 to 8 instructors). Fill rate and retention are your game. Trial show rate and 90-day survival tell you whether onboarding turns a curious drop-in into a regular. Churn is your most expensive number because fixed costs (rent, instructors) are high and your price is premium, so each lost member is a big contribution-margin hit. Track monthly churn and failed-payment rate obsessively; at your price point, a few recovered cards a month is real money.
Independent gym (150 to 500 members, 3 to 10 staff). You have enough volume that small percentages become big numbers, so funnel metrics (response, booking, show, conversion) are worth optimizing. But your biggest exposure is churn and failed payments: at 300-plus members even 3% monthly churn is 9+ people a month to replace, and a 2% failed-payment rate is six memberships of leaked revenue. Put the scorecard on the wall; with a team, numbers only improve when everyone can see them. If churn and replacement are eating you, run the break-even math to see what the leak costs.
Steal this: the one-page monthly scorecard
Copy this into a note or spreadsheet. On the last day of each month, fill in the “This month” column, compare it to last month, and circle the one number that moved the wrong way. That circled number is your project for next month.
MONTHLY SCORECARD - month: __________

GETTING LEADS TO SHOW UP
1. Lead response time (median)        ____ min   (target: minutes)
2. Lead-to-trial booking rate         ____ %     (vs last month)
3. Trial show rate                    ____ %     (target: 80%+)

TURNING TRIALS INTO MEMBERS
4. Trial-to-member conversion         ____ %     (vs last month)

KEEPING MEMBERS
5. Monthly churn rate                 ____ %     (target: under 3%)
6. 90-day new-member survival         ____ %     (watch the first 90 days)
7. Failed-payment rate                ____ %     (recover fast)

WHAT IT ADDS UP TO
8. Member lifespan / LTV              ____ mo / $____
9. ARPU (collected ÷ members)         $____      (should rise)
10. Net member growth (gained - lost) ____       (positive & steady)

Members I must sign just to hold flat = members x monthly churn = ____
The one number I'm fixing next month: ________________________________
Three rules make this work. First, use the same definition every month, especially for “lead,” or your trends are noise. Second, always use collected revenue, never billed, so failed payments cannot hide. Third, do not try to fix all 10 at once. Pick the one worst number, fix it, and let the fix show up next month. A scorecard you actually fill in beats a dashboard you admire and never read.
Objections operators raise
“I don’t have time to track 10 numbers every month.” It is 30 minutes once a month, and most numbers already sit in your booking and payment tools. Compare that to running blind for a quarter and finding out in March you have shrunk since January. Owners who say they have no time are usually the ones reacting all day to problems a scorecard would have flagged weeks earlier.
“My software already shows me a dashboard.” It shows billed revenue and a member count, the two numbers most likely to flatter you. It rarely shows median lead response outside hours, trial show rate, 90-day cohort survival, or collected-versus-billed ARPU. The scorecard is not more software; it is the discipline of pulling the numbers that tell the truth and writing them where you will compare them.
“I’m a small studio, this is overkill.” The smaller you are, the more each number matters, because you have no volume to average out a bad month. A solo trainer who loses 3 clients and does not notice for eight weeks has lost serious income. You do not need a 500-member gym’s infrastructure, but you absolutely need to know your conversion and your churn.
“Won’t this make me obsess over numbers instead of coaching?” The opposite. Thirty minutes a month frees you to coach the rest of the time, because you steer on data instead of lurching from fire to fire. You look once, act on one thing, and get back to the floor. Numbers you check monthly reduce anxiety; numbers you avoid create it.
The bottom line
Your member count is the number you quote and the number that hides the most. It nets every win against every loss and cannot tell you whether you are winning the top of the funnel or losing the bottom. The 10 numbers on this scorecard split it apart: how fast you answer, how many book and show, how many convert, how many you keep, what each is worth, and whether you are actually growing.
None of it needs an accountant or new software. It needs 30 minutes on the last day of the month, the same definitions every time, collected revenue instead of billed, and the discipline to fix one number at a time. Do that for three months and you will stop guessing whether you “had a good month.” You will know, you will know why, and you will know what to work on next.
Go back to that last-day-of-the-month conversation. The pause when your partner asked if you were up or down? Next month you will not pause. You will have the number, and the nine behind it.
Frequently asked questions
What metrics should a gym owner track every month?
Ten numbers cover the whole business: lead response time, lead-to-trial booking rate, trial show rate, trial-to-member conversion rate, monthly churn rate, 90-day new-member survival, member lifespan and lifetime value (LTV), average revenue per member (ARPU), failed-payment rate, and net member growth. Together they show whether you are winning at the top of the funnel (leads and trials) or losing at the bottom (churn and failed payments), which a single member count can never tell you.
What is a good monthly churn rate for a gym?
Ongoing monthly churn commonly runs 2% to 3.5%, and keeping it under 3% is a reasonable target for most independent gyms and studios. The industry retained about 66.4% of members across 2025, meaning roughly one in three leaves each year (Health & Fitness Association). Track voluntary cancellations and failed-payment losses separately, because the failed-payment ones are silent and often go unchased.
How do I calculate gym member lifetime value?
The fast estimate is your average monthly membership fee divided by your monthly churn rate, which gives revenue per member before they leave. Average member lifespan in months is roughly 1 divided by monthly churn, so at 4% monthly churn a member stays about 25 months. LTV rises non-linearly as churn falls, which is why shaving even one point off churn adds months of revenue per member across your whole roster.
What is the difference between billed and collected revenue?
Billed revenue is what your system attempted to charge; collected revenue is what actually landed in your account. The gap is your failed-payment rate: expired cards, limits, and declines that nobody chased. Always run your scorecard on collected revenue, because dividing billed revenue by member count overstates ARPU by exactly your failed-payment rate and hides money you earned but never banked.
How fast should a gym respond to a new lead?
In minutes, not hours. A long-running lead-response study found the odds of qualifying a lead fall about 21-fold when response time slips from 5 minutes to 30. Most gyms answer business-hours leads quickly and let evening and weekend inquiries, often the most ready-to-buy ones, wait overnight. Measure your median response time outside staffed hours separately, because that is usually where leads go cold.
Written by Bryce Kendrick, Fitness Growth Strategist. Bryce spent eight years managing the floor and front desk at a fast-growing CrossFit box before moving full-time into automation for gyms. He writes the way he coaches: direct, numbers-first, and allergic to fluff.
Related posts
- Gym Member Lifetime Value: How to Calculate It and Increase It
- How Many Members Does Your Gym Need to Break Even?
- Speed to Lead for Gyms: Why the First 5 Minutes Decide Who Becomes a Member
- How to Stop Silent Churn at Your Studio
- Failed-Payment Recovery for Gyms: The Dunning Playbook
- Gym Industry Statistics 2026: 30+ Benchmarks Every Operator Should Know